Home · P&ID
The home view is the operator's primary workspace. It shows a live P&ID of the 6-column train, per-column pressure readings, live predicted concentrations, and current batch state. The right side defaults to the Mini Charts side panel.
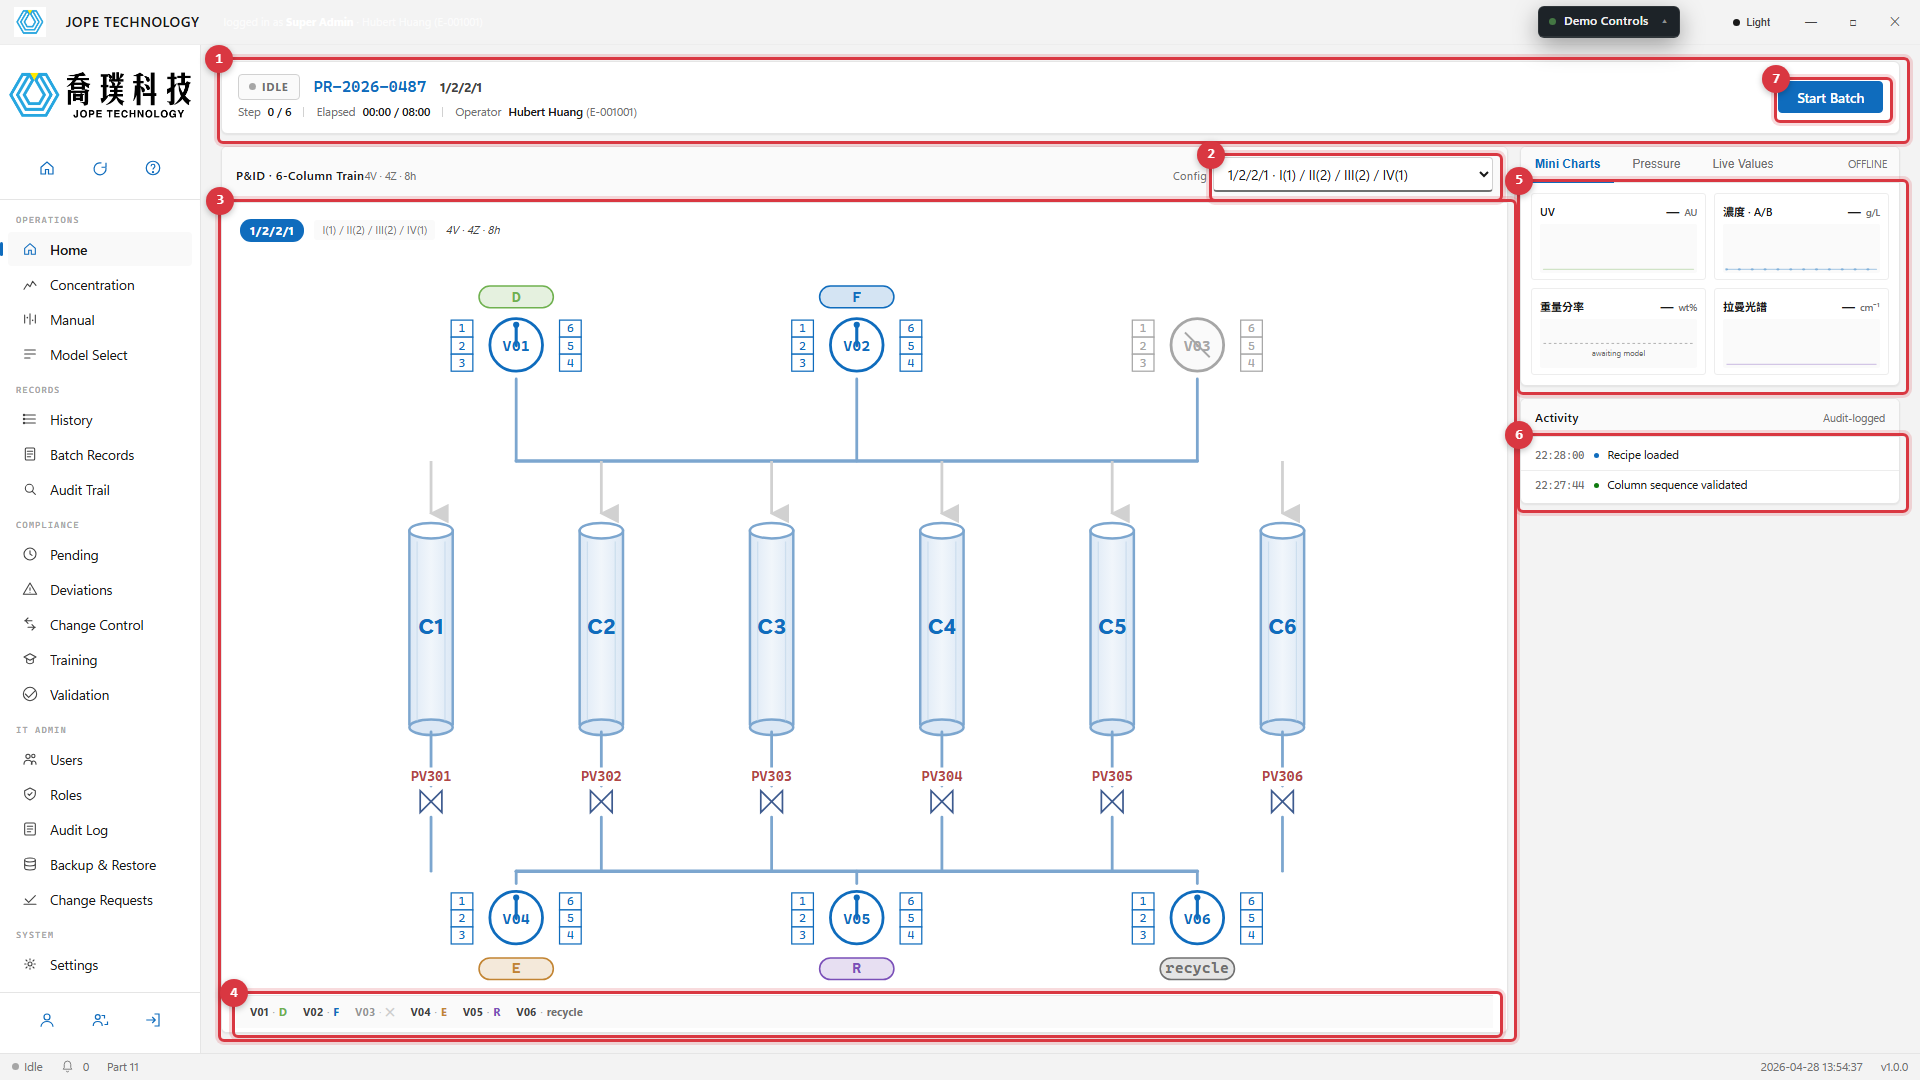
Figure 3.1 · Home idle · IDLE state lamp, no valves feeding, pressure chart at baseline
- Batch header · ID · current config · step indicator · elapsed time
- Config dropdown · 7 standard configurations (locked while running)
- P&ID · 3 inlet rotary valves · 6 columns · 6 pneumatic valves · 3 outlet rotary valves
- Valve function legend (V01 = D · V02 = F · V03 = ✕ etc.)
- Mini Charts · UV / Concentration / Weight Fraction / Raman tiles
- Activity log · most recent audit-logged events
- Start Batch button · opens electronic signature dialog
Starting a Batch
Click Start Batch to open the electronic signature dialog. After signing, the batch transitions to RUNNING, the P&ID animates (line flow, valve arms rotate to step 1), and the Historian begins recording every sensor reading and prediction.
- Click Start Batch at the top right
- The Electronic Signature dialog appears, showing the batch reference and recipe
- Enter your password and select a signing meaning (Approved · Reviewed · Authorship)
- Click Sign. The dialog closes, the batch becomes
RUNNING, and an audit entry is written
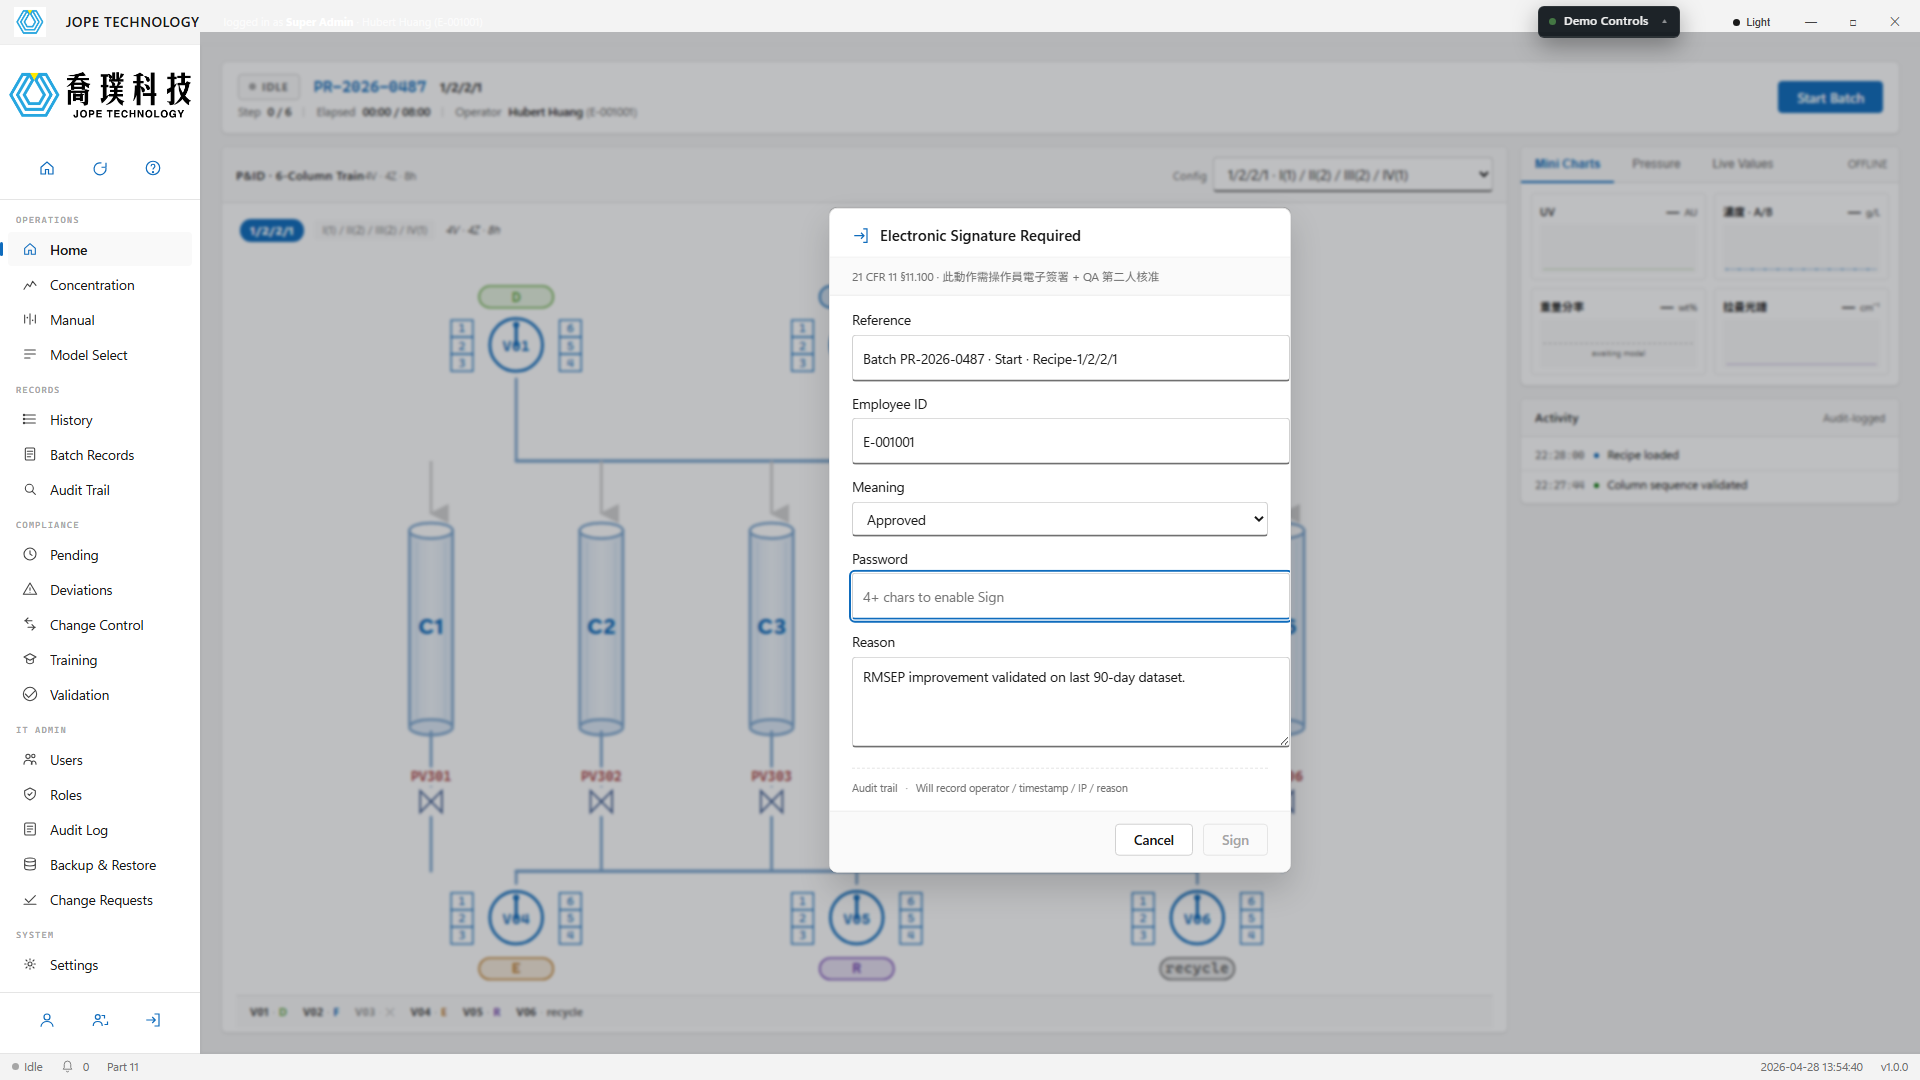
Figure 3.2 · Electronic Signature dialog · meaning selector · reason field · password
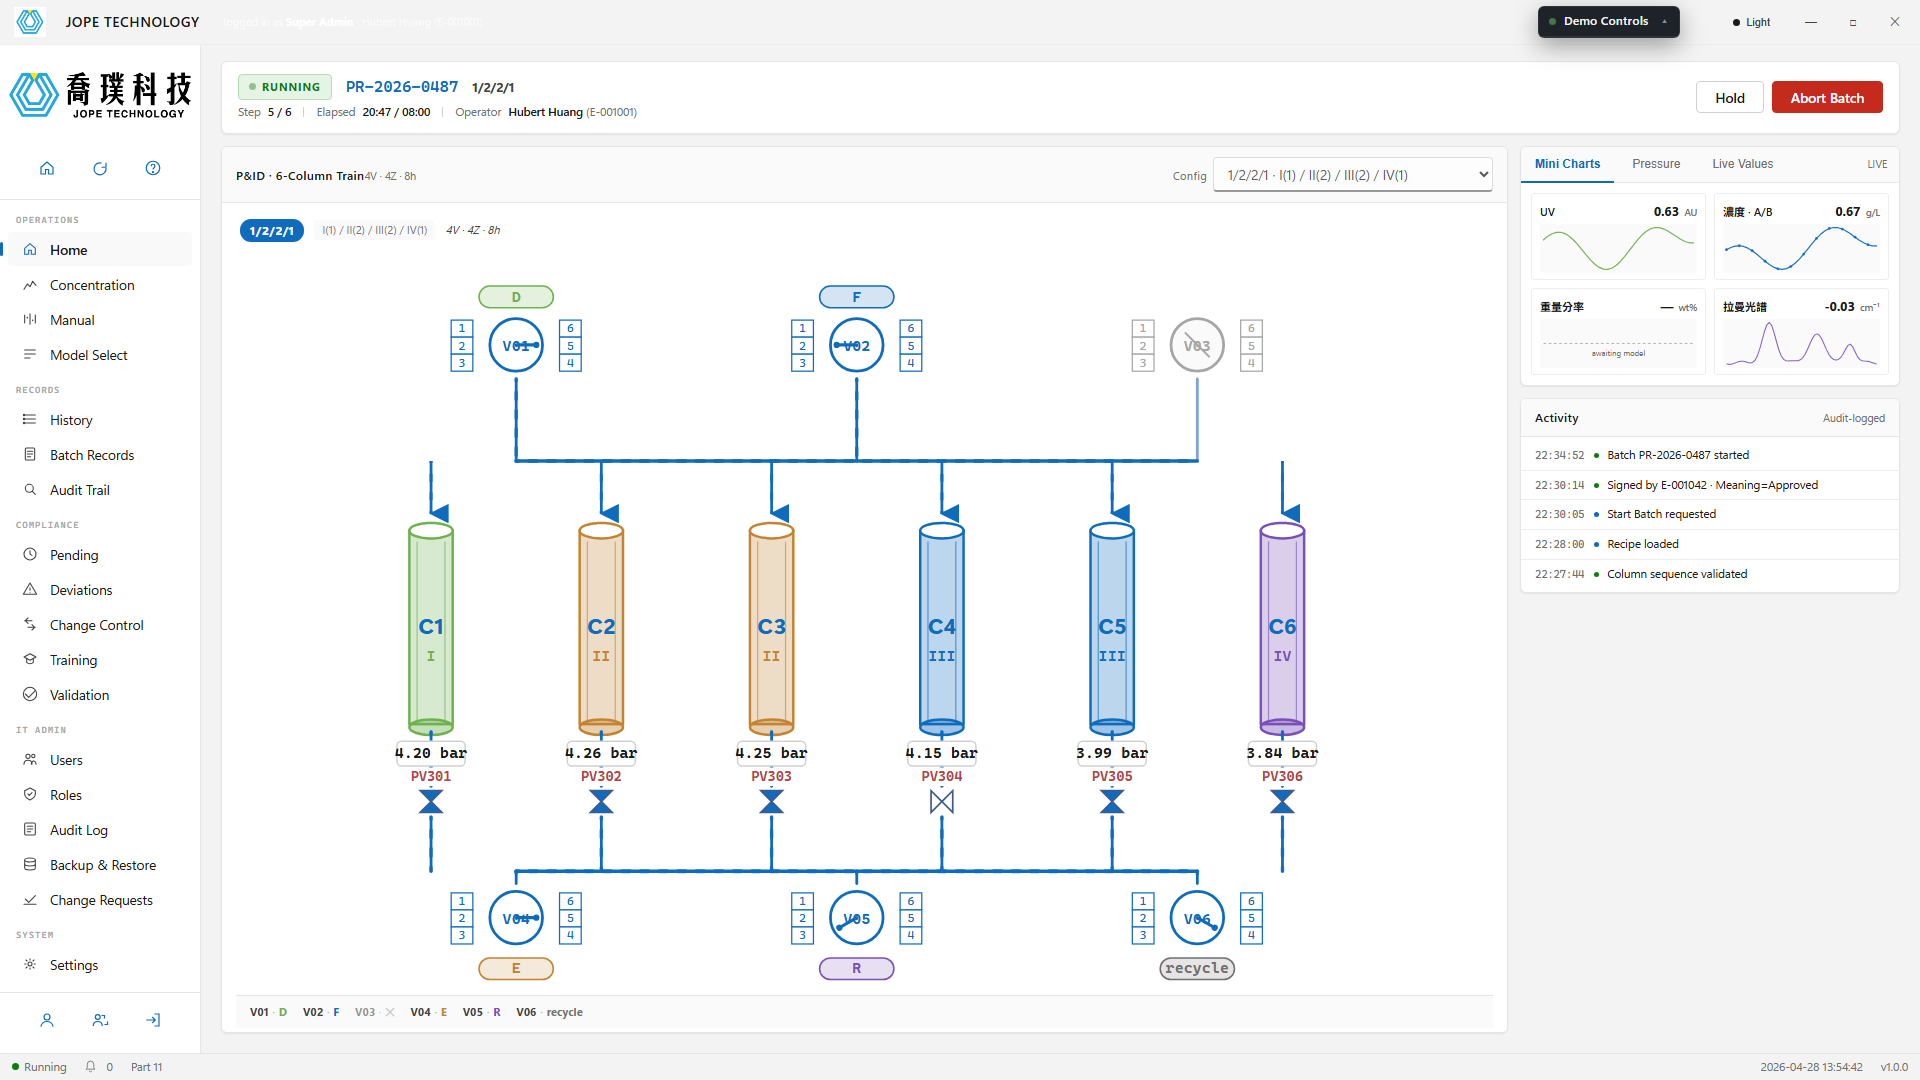
Figure 3.3 · Home running · RUNNING state lamp · animated lines · columns coloured by recipe
Handling Alarms
When any sensor crosses a configured threshold, the offending column pulses red on the P&ID, the pressure chart highlights its trace, and an alarm dialog opens. The operator must acknowledge or hold the batch — both actions are signed and audit-logged.
Acknowledge keeps the batch running under observation.
Hold Batch transitions to HELD immediately, throttles pumps, and freezes valves at their last safe position.
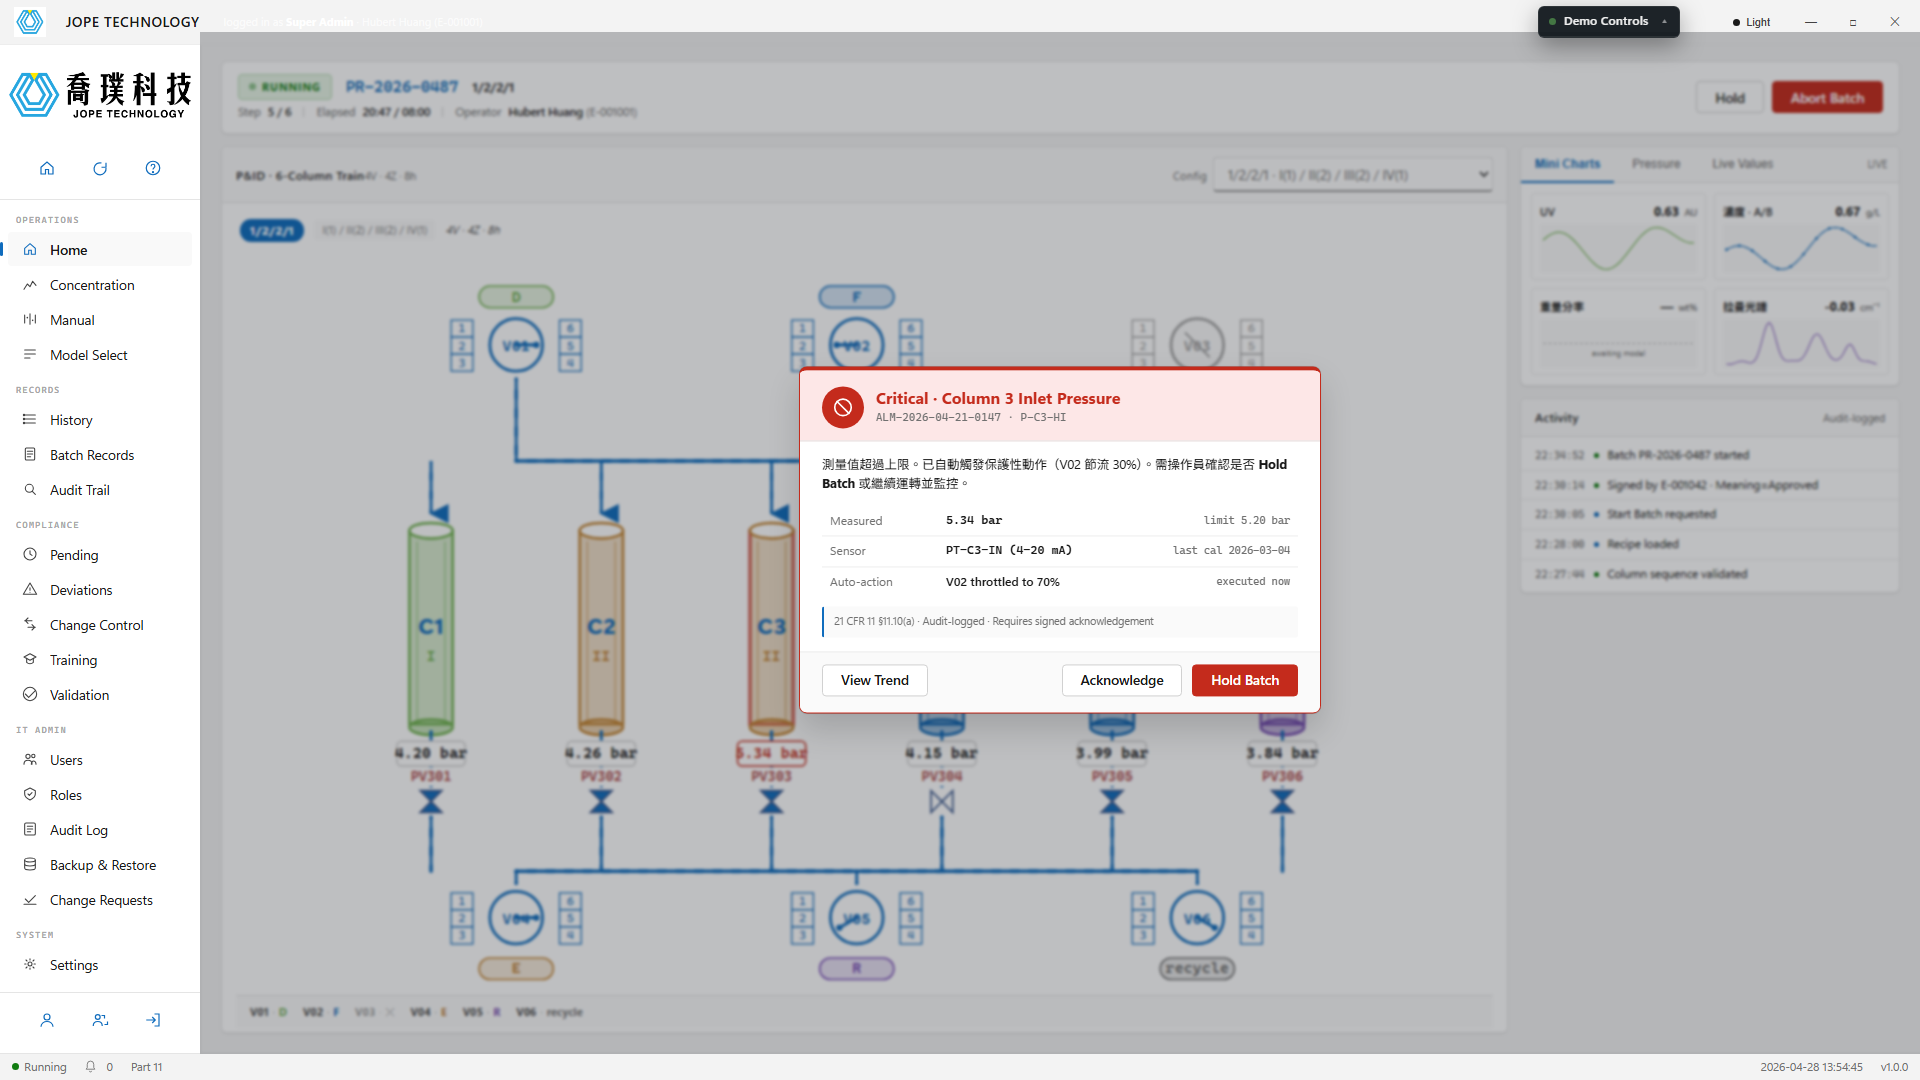
Figure 3.4 · Alarm dialog · Column 3 inlet pressure exceeds 5.20 bar limit
Switching Config
The configuration can only be switched while in IDLE. The system enforces this by disabling the dropdown in RUNNING and HELD states. Every configuration change generates a change control record.
| Code | Zone layout | Active valves | Cycle |
|---|---|---|---|
1/2/2/1 | I(1) / II(2) / III(2) / IV(1) | 4 | 8 h |
2/2-2 | I(2) / II(2) / III(2) | 4 | 6 h |
2/2/2 | I(2) / II(2) / III(2) | 4 | 5 h |
1-1/2/2 | I(1) / W(1) / II(2) / III(2) | 6 | 8 h |
2-1-3 | S(2) / W(1) / F(3) | 6 | 4 h |
2-0-4 | S(2) / F(4) | 4 | 3 h |
3-0-3 | S(3) / F(3) | 4 | 4 h |
Mini Charts side panel
The home view's right panel defaults to the Mini Charts tab, surfacing the four most important live quantities so the operator never has to leave the home view to scan process state:
- UV · UV detector reading (AU)
- Concentration · A/B · live concentrations from the calibration model (g/L)
- Weight Fraction · output of the dynamic soft-sensor model (wt%, currently a placeholder pending model delivery)
- Raman · live spectrum profile (cm⁻¹); the full view is on the Raman tab of the Concentration page
The side panel also has two other tabs: Pressure shows the 6-column pressure traces; Live Values shows EPA / DHA / DPA spot values plus the next-switch countdown. The three tabs are independent — switch as the task requires.